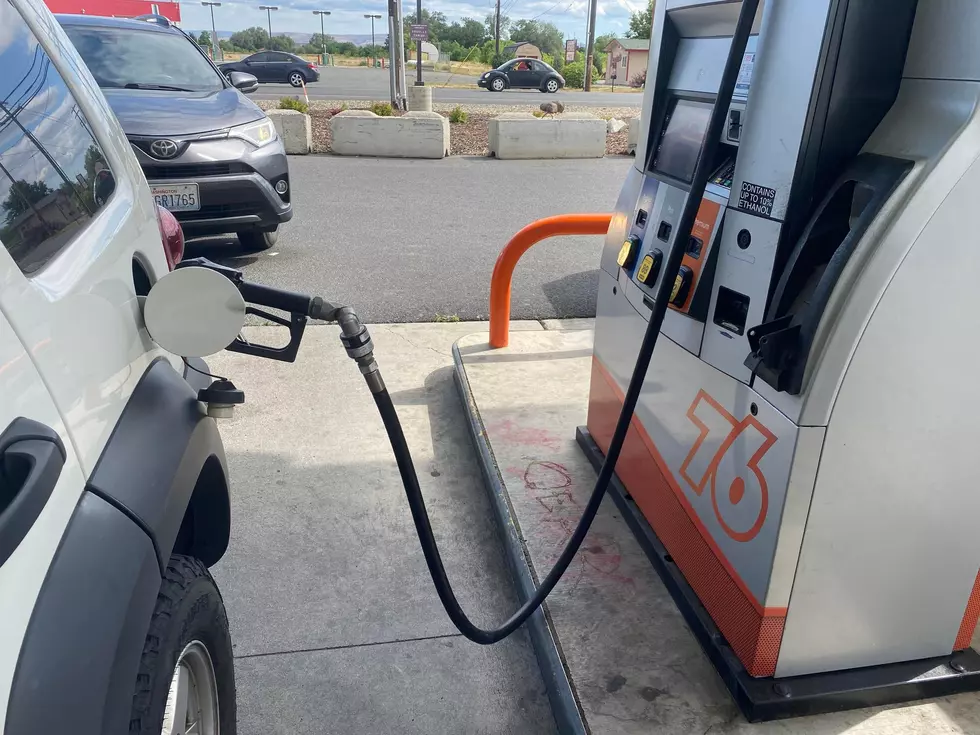
Time to Fill Up With Cheaper Gas This Week in Yakima
Drivers in Yakima are enjoying cheaper gas prices down 13.4 cents per gallon in the last week, averaging $4.54 per gallon, according to GasBuddy's survey of 91 stations in Yakima. GasBuddy says prices in Yakima are 39.6 cents per gallon lower than a month ago and stand 73.9 cents per gallon higher than a year ago.
The price of diesel is also down today
If you pump diesel fuel the national average price of diesel has declined 2.39 cents in the last week and stands at $5.28 per gallon.
You'll find the cheapest gas in the valley in Wapato priced at an average of $3.78 a gallon.
On the national side the average price of gas has fallen 4.7 cents per gallon in the last week, averaging $3.72 per gallon.
Even the national price is down
The national average is down 3.0 cents per gallon from a month ago and stands 34.4 cents per gallon higher than a year ago, according to GasBuddy data compiled from more than 11 million weekly price reports covering over 150,000 gas stations across the country.
The future is uncertain but declines are happening in the west
"For the third consecutive week, we've seen the national average price of gasoline decline, and while it's good news for most regions with a continued drop in prices, the Northeast is bucking the trend and seeing a noticeable jump due to tight supply," says Patrick De Haan, head of petroleum analysis at GasBuddy. "The national average is closing in on the previous low from September, which was interrupted when refinery issues caused prices to skyrocket in the West and Great Lakes. With those issues addressed, the West has seen prices plummet, including a nearly 90 cent per gallon decline in California in less than a month. Compare that to the Northeast, where prices have jumped some 10-25 cents per gallon, demonstrating there's much regionality to current gasoline price trends. Add in diesel prices that remain high amidst extremely tight supply, and there's definitely some challenges that lie ahead."
Remember when?
Historical gasoline prices in Yakima and the national average going back ten years:
October 31, 2021: $3.80/g (U.S. Average: $3.38/g)
October 31, 2020: $2.59/g (U.S. Average: $2.11/g)
October 31, 2019: $3.38/g (U.S. Average: $2.61/g)
October 31, 2018: $3.42/g (U.S. Average: $2.77/g)
October 31, 2017: $2.88/g (U.S. Average: $2.48/g)
October 31, 2016: $2.72/g (U.S. Average: $2.20/g)
October 31, 2015: $2.38/g (U.S. Average: $2.17/g)
October 31, 2014: $3.20/g (U.S. Average: $2.99/g)
October 31, 2013: $3.43/g (U.S. Average: $3.27/g)
October 31, 2012: $3.79/g (U.S. Average: $3.51/g)
LOOK: See how much gasoline cost the year you started driving
Gallery Credit: Sophia Crisafulli
See the Must-Drive Roads in Every State
Gallery Credit: Sarah Jones
READ ON: See the States Where People Live the Longest
Gallery Credit: Hannah Lang

More From KMGWFM

![Top 5 Most Expensive Homes For Sale in Yakima County [NEW LISTINGS]](http://townsquare.media/site/848/files/2022/05/attachment-Top-5-Most-Expensive-Homes-For-Sale-Featured.jpg?w=980&q=75)

![Yakima’s Most Expensive House for Sale is Over $2.5M! [PHOTOS]](http://townsquare.media/site/848/files/2019/03/house8.jpg?w=980&q=75)